Figure 6.
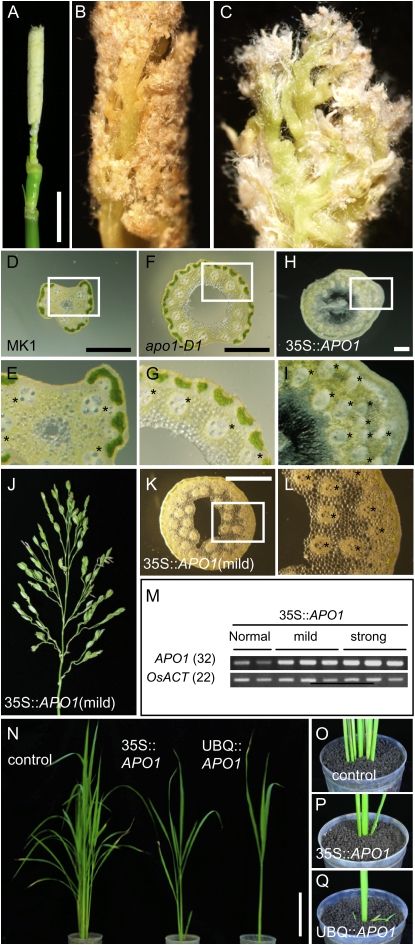
Ectopic over expression of APO1 caused an extreme increase in inflorescence branching. A to C, Different views of an inflorescence of 35S∷APO1. B and C, Higher magnification of the inflorescence shown in A; bar = 1 cm. D to I, Cross sections of inflorescence stems of wild type (‘MK1’, D and E), apo1-D1 (F and G), and 35S∷APO1 with severe phenotype (H and I). E, G, and I, Closer views of the stem enclosed with white boxes in D, F, and H, respectively. Vascular bundles are indicated with asterisks; bar = 0.5 mm. J, An inflorescence of 35S∷APO1 showing a mild phenotype. K and L, Vascular bundles of the 35S∷APO1 with mild phenotype are indicated with asterisks; bar = 0.5 mm. L, The close-up of the stem region enclosed with a white box in K. M, Expression level of APO1 analyzed by RT-PCR. The number indicates the numbers of PCR cycles. N, Young plants of a control containing an empty vector (‘Nipponbare’) and transgenic 35S∷APO1 and UBQ∷APO1; bar = 10 cm. O to Q, Tiller growth in the plants shown in N.

