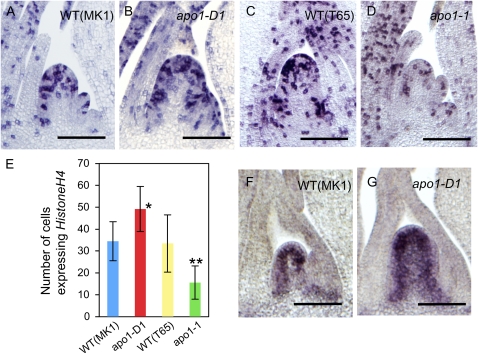
Figure 8.
Pattern of cell proliferation in the IM. A to D, In situ hybridization analysis of Histone H4 expression in wild type (WT; ‘MK1’; A), apo1-D1 (B), wild type (T65; C), and apo1-1 (D). E, Number of cells expressing Histone H4. n = 6 for wild type (‘MK1’) and apo1-D1, n = 8 for wild type (T65) and apo1-1. F and G, In situ hybridization analysis of OSH1 expression in wild type (MK1; F) and apo1-D1 (G). Asterisks indicate significantly different from wild type at *, P < 0.05; **, P < 0.01; bars = 100 μm.

