Figure 4.
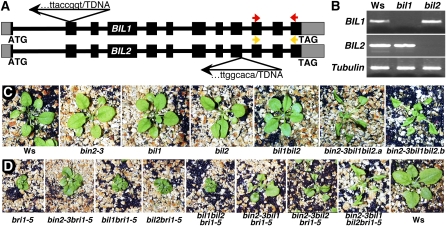
Genetic analysis of T-DNA insertional mutations of BIN2 and its two closest homologs. A, Schematic representation of T-DNA insertions in the BIL1 and BIL2 genes. Black boxes represent protein-encoding exon, gray boxes denote untranslated regions, and thick lines indicate introns. Arrows indicate orientations of T-DNA insertions from its left to right border, and the sequences above and below the arrows show the junction between flanking genomic DNAs and the inserted T-DNAs. The colored arrows represent the primers used for RT-PCR analysis of BIL1 or BIL2 gene expression. B, RT-PCR analysis of BIL1 and BIL2 gene expression in the wild type and bil1 and bil2 mutants. β-TUBULIN was used as a control. C, Shown from left to right are soil-grown 4-week-old Ws wild type, bin2-3, bil1, bil2, bil1bil2, and two individual bin2-3bil1bil2 mutants. D, Genetic analysis of bri1-5 with loss-of-function mutations of BIN2, BIL1, and BIL2. Shown from left to right are 4-week-old soil-grown bri1-5, bin2-3bri1-5, bil1bri1-5, bil2bri1-5, bil1bil2bri1-5, bin2-3bil1bri1-5, bin2-3bil2bri1-5, bin2-3bil1bil2bri1-5, and the Ws wild-type control.

