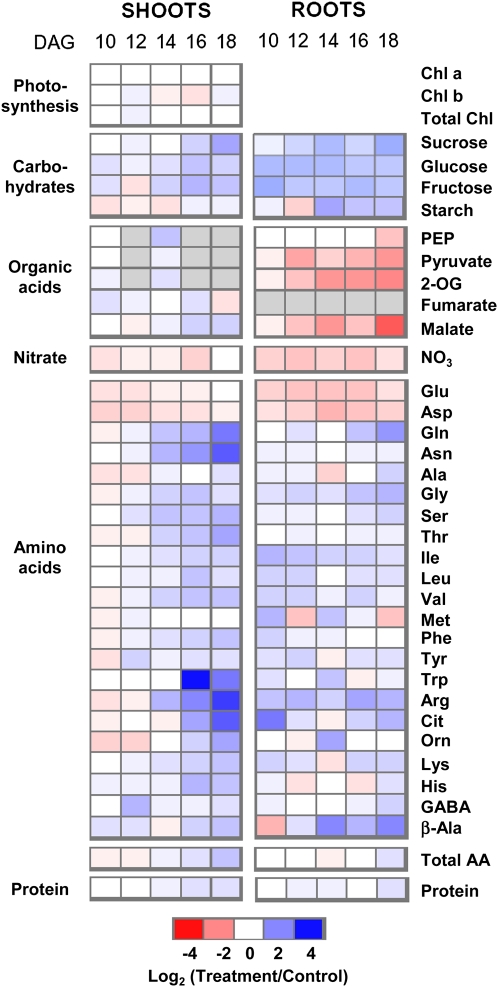
Figure 1.
Changes in metabolite concentrations in roots and shoots of Arabidopsis grown on low K. For each time point, approximately 200 plants were pooled. Blue color indicates an increase and red indicates a decrease in metabolite concentration in low-K-grown plants compared with control plants. Different shades of red and blue express the extent of the change according to the color bar provided (log2 ratio of low K to control). White indicates no change; gray indicates not determined. For absolute values, see Supplemental Table S1. AA, Amino acids; Chl, chlorophyll.

