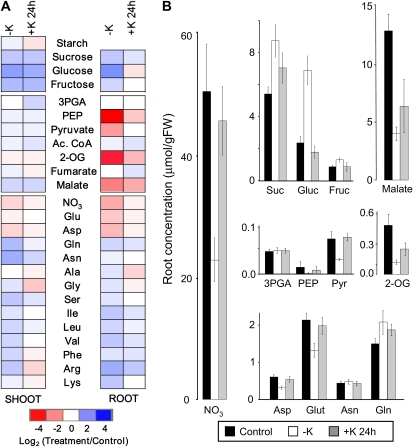
Figure 2.
Reversibility of metabolite changes induced by low K. A, Changes in metabolite concentrations in roots and shoots of 2-week-old Arabidopsis plants grown in low-K (–K) medium for 14 d and subsequently resupplied with K (+K) for 24 h. Changes are in relation to corresponding values measured in plants grown in control medium. Colors and shading are as in Figure 1. B, Absolute concentrations of selected metabolites in the roots of plants grown in control medium (black bars), –K medium (white bars), and –K medium with K added for 24 h (gray bars). Data are means from at least three independently grown and treated plant batches, each of which comprised approximately 100 plants. Raw data and statistics are supplied in Supplemental Table S2. (Note that PEP concentrations were close to the detection limit, so relative changes shown in A should be viewed with caution.) Ac. CoA, Acetyl-CoA; FW, fresh weight; 3PGA, 3-phosphoglycerate; Pyr, pyruvate.

