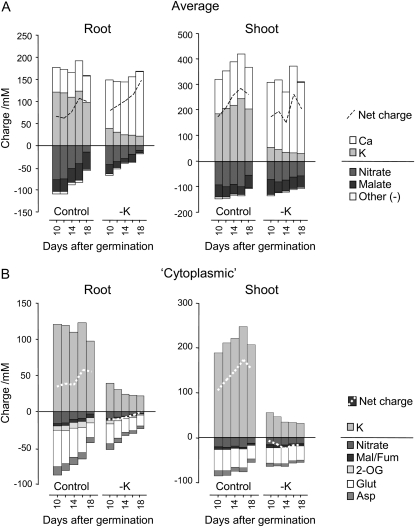
Figure 5.
Electric charges provided by inorganic ions and metabolites. Charge concentration was calculated by multiplying metabolite concentration (as listed in Supplemental Table S1) by the overall charge of the molecule. Plants and growth conditions were as described for Figure 1. A, Charges based on tissue concentrations. These are dominated by the vacuolar lumen. B, Predicted charges in the cytoplasm calculated according to published data for relative cytoplasmic/vacuolar concentrations and volume (see “Materials and Methods”).

