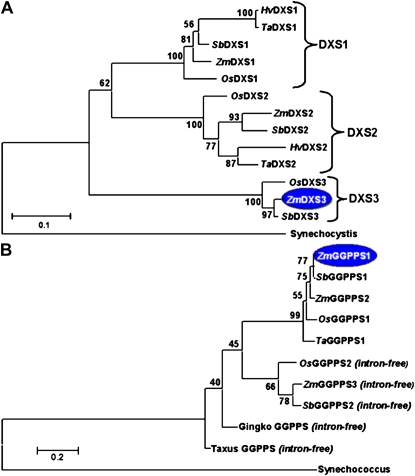
Figure 3.
Phylogenetic analysis based on translation products. A, DXS gene family. GenBank accession numbers are in parentheses: Synechocystis (sll1945, BAA17089.1), Zea mays (ZmDXS1, TC312721; ZmDXS2, TC293862; ZmDXS3, TC307233), Oryza sativa (OsDXS1, LOC_Os05g33840; OsDXS2, LOC_Os07g09190; OsDXS3, LOC_Os06g05100), Sorghum bicolor (SbDXS1, Sb09g020140; SbDXS2, Sb02g005380; SbDXS3, Sb10g002960); Hordeum vulgare (HvDXS1, TC149768; HvDXs2, TC152494); Triticum aestivum (TaDXS1, TC238788; TaDXS2, TC258088). B, GGPPS gene family. GenBank accession numbers are in parentheses: Synechococcus (crtE, ABI45773); Zea mays (ZmGGPPS1, EF417573; ZmGGPPS2, EF417574; ZmGGPPS3, EF417575); Oryza sativa (OsGGPPS1, LOC_Os07g39270; OsGGPPS2, LOC_Os01g14630); Sorghum bicolor (SbGGPPS1, Sb02g037510, SbGGPPS2, Sb03g009380); Gingko biloba (AY371321); Taxus media (AY566309). Maize enzymes are highlighted in blue if transcripts correlated with carotenoid content. [See online article for color version of this figure.]

