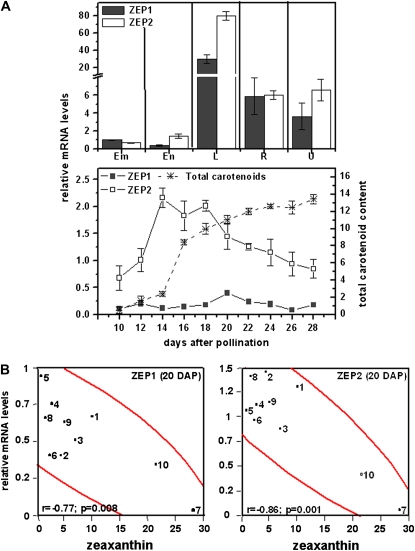
Figure 7.
Transcript profiling of ZEP gene family members. A, Top, tissue (see Fig. 4); bottom, developing endosperm (see Fig. 5). Transcript levels were expressed relative to endosperm levels at 20 DAP. Em, Embryo; En, endosperm; L, leaf; R, root; U, unfertilized ovule. B, Pearson correlation (r) and statistical significance (P) for comparison of transcript levels and kernel carotenoid content in maize inbred lines (see Fig. 6). Means of three replicates ± sd are shown. [See online article for color version of this figure.]

