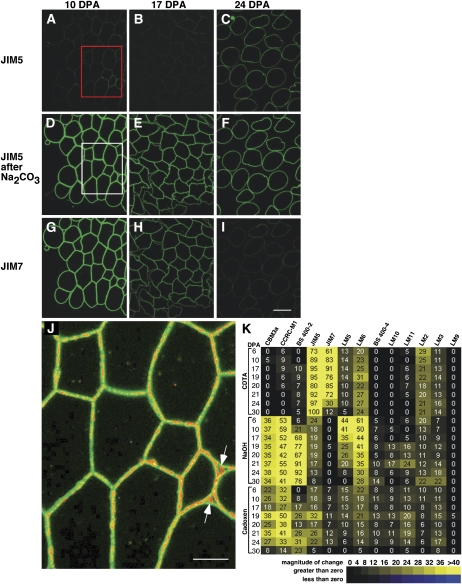
Figure 4.
Fluorescence analysis of cotton fiber cell wall epitopes illustrates changes correlated temporally with the end of elongation as well as transition-stage CFML breakdown. A to I, Fluorescence micrographs of semithin sections of 10-, 17-, and 24-DPA cotton fiber cross-sections immunolabeled with JIM5 or JIM7. Sections were optionally pretreated with 100 mm Na2CO3 as a deesterifying agent prior to labeling. Successive sections of the same sample are shown for each DPA. The exposure time was equivalent, and no image processing was performed, which allowed comparison of labeling intensity between samples. The boxed areas in A and D were superimposed to produce J (see below). At 10 and 17 DPA (D, E, G, and H), strong signals arose from HG distributed throughout the primary wall following labeling with JIM5 (after Na2CO3) and JIM7. These images show that the fibers were bundled into a simple tissue during elongation. In contrast, by 24 DPA, CFML degradation had occurred to release individual fibers (C and F). Comparison of C with A and B shows that HG in the main primary wall was less esterified after elongation ended, a conclusion that was reinforced by the strong decrease in the JIM7 signal at 24 DPA in I compared with G and H. Bar in I = 20 μm for A to I. J, The dim positive signal for JIM5 untreated (boxed area in A; signal changed to red) was superimposed onto the bright signal after Na2CO3 pretreatment (boxed area in D; signal retained as green). The red signal aligned with the middle of joined primary walls between adjacent fibers in many locations and filled larger spaces between three fibers (arrows), indicating that fiber junctions were enriched in HG with a lower degree of esterification. Bar = 10 μm. K, Heat map arising from CoMPP analysis of 6- to 30-DPA fiber extracted with CDTA, NaOH, and cadoxen. The 24 extracts (listed on the y axis) were printed and exposed to 13 cell wall polymer probes (listed on the top x axis). Supplemental Table S1 shows binding properties of the probes, and all intensity values are relative to 100. In the CDTA fraction, the inverse changes in the JIM5 (increasing) and JIM7 (decreasing) signals after 20 DPA correlate with fluorescence immunolabeling (compare C and I). In the cadoxen fraction, the CCRC-M1 and JIM5 epitopes (but not the JIM7 epitopes) had elevated signals at 19 to 21 DPA, which correlated with the timing of release of these epitopes from the CFML as observed by TEM.

