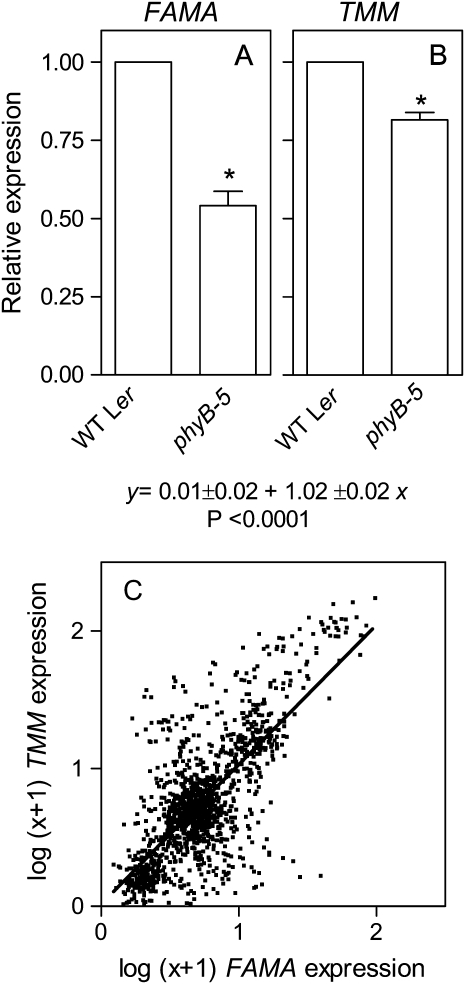
Figure 5.
Phytochrome promotes the expression of FAMA and TMM in the leaves and the positive correlation in the expression of these two genes extends beyond phyB action. A and B, Plants of the phyB mutant and its wild type were grown under white light. Data are means and se of three biological replicates. Asterisk (*) denotes significant differences (P < 0.05) according to ANOVA. C, Positive correlation between the expression of FAMA and TMM. The figure includes 633 data points corresponding to different developmental contexts and biotic or abiotic treatments (1–3 biological replicates per point) taken from 46 experiments (1,388 microarrays; www.arabidopsis.org). Data were normalized to the median of each experiment and transformed as ln (x + 1) (Buchovsky et al., 2008). The line shows least square linear fit of the 633 points and the significance is indicated.

