Figure 3.
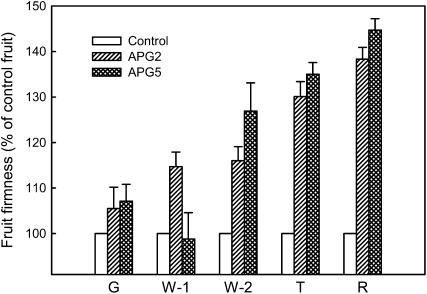
Fruit firmness at different stages of maturation in two transgenic APG lines. Firmness was evaluated during the second year of analysis and is expressed as the percentage of control fruit firmness at each developmental stage. G, Green fruit; W-1, white fruit with green achenes; W-2, white fruit with brown achenes; T, turning fruit; R, full red fruit. Bars represent means ± se of a minimum of 20 fruits per line and stage.

