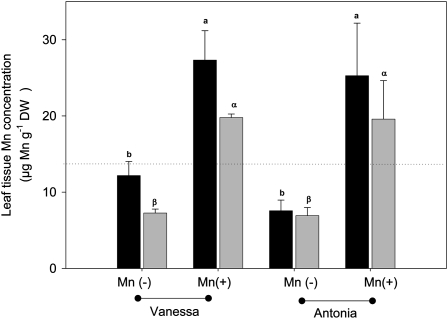
Figure 2.
Mn concentrations in leaf tissue for the Mn-efficient genotype Vanessa and the Mn-inefficient genotype Antonia measured 44 d (black bars) and 50 d (gray bars) after planting, respectively. Mn(+) and Mn(−) indicate the Mn sufficiency and deficiency treatments, respectively. The critical threshold concentration for Mn in leaf tissue (17 μg Mn g−1 dry weight [DW]) is indicated by the dotted line (Reuter et al., 1997). Means ± se (n = 3) with the same letter at each date are not significantly different.

