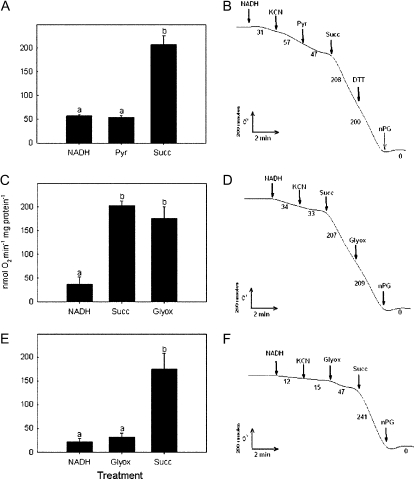
Figure 1.
Rate of O2 uptake in mitochondria from thermogenic sacred lotus receptacles. Each column (means ± se, n = 3–4) represents a subsequent addition to the O2 electrode chamber of 2 mm NADH, 5 mm pyruvate (Pyr), or 20 mm succinate (Succ) and/or 5 mm glyoxylate (Glyox). These additions were made in the presence of 1 mm KCN. Columns with different letters are significantly different. Typical O2 uptake traces per milligram of mitochondrial protein are shown to the right of the graphs. Numbers below the traces are the respiration rates (nmoles O2 min−1 mg protein−1). nPG, n-Propyl gallate.

