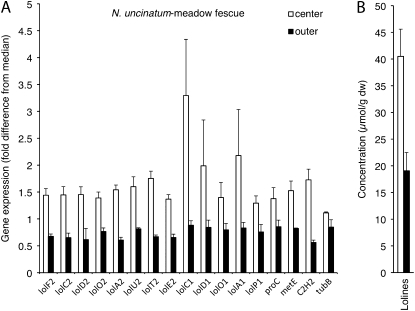
Figure 4.
Relative expression of N. uncinatum genes (A) and LA concentrations (B) in center leaf blades (white bars) and outer leaf blades (black bars) of MF. Gene expression is indicated as fold-difference from the median for each gene in the experiment. Error bars show ses of the mean, where n = 2 for lolC1, lolA1, lolO1, and lolD1 center leaves, and n = 4 for all others. dw, Dry weight.

