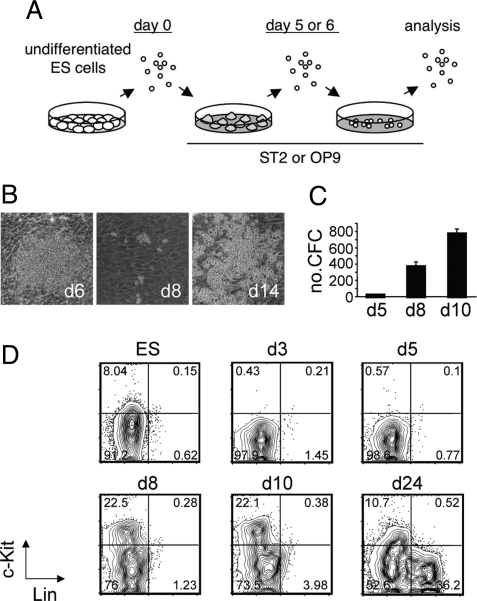
Fig. 1.
Differentiation of embryonic stem (ES) cells into hematopoietic cells. (A) A schematic overview of the culture system. (B) Representative pictures of hematopoietic differentiation of ES cells on ST2 stromal cells. (C) Hematopoietic colony-forming activity during ES cell differentiation. The numbers of colony-forming cells (CFCs) per well of the secondary plates plotted against the time course of culture are presented. These cultures were initiated with 105 cells on day 5. Values are the mean ± SD of triplicate cultures. A representative result from 2 independent experiments is shown. (D) Expression of c-Kit and lineage markers (Lin) during hematopoietic differentiation of ES cells. The plots shown are pregated on forward scatter/side scatter (FSC/SSC). The percentages of each fraction are indicated.

