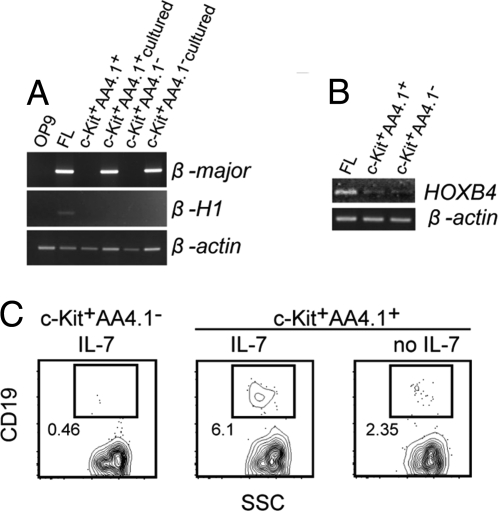
Fig. 3.
The β-globin expression and lymphoid potential of AA4.1+ and AA4.1− cells. (A) RT-PCR analysis of β-major and β-H1 expression in c-Kit+AA4.1+ and c-Kit+AA4.1− cells or c-Kit+AA4.1+ and c-Kit+AA4.1− cells cultured for a week on OP9 stromal cells. Lanes of OP9 and embryonic day 12.5 (E12.5) fetal liver (FL) are shown as controls. (B) RT-PCR analysis of HOXB4 expression on AA4.1+ and AA4.1− cells. Expression in E12.5 FL is shown as a control. (C) B lymphocyte potential of AA4.1+ and AA4.1− cells. Sorted cell subsets were cultured under B cell culture conditions for 4 weeks on OP9 stromal cells and then analyzed for CD19 expression. A representative result from 3 independent experiments is shown. The plots shown are pregated on FSC. The numbers indicate the percentages of the positive fraction.

