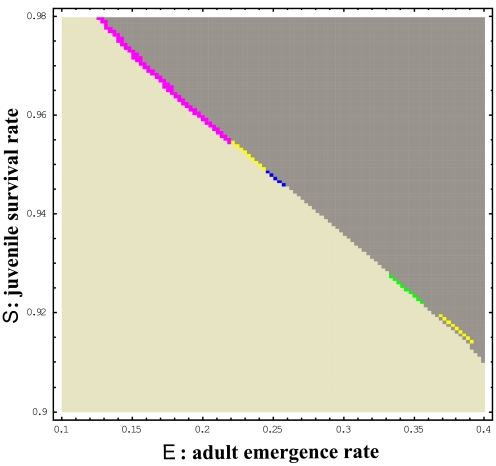
Fig. 3.
Phase planes of population sizes (relative to the initial population sizes) of 1,000-year survivals for juvenile survival rates S and adult emergence rate E among 11 pure broods of 10- to 20-year cycles without the Allee effect (control; Nc = 0). The population sizes are categorized as increasing or decreasing compared with the corresponding initial population sizes (N0 = 1,000). The populations are shown as: three or more cycles increasing (dark gray); shown prime numbers only increasing with the rest decreasing (green: 13 only; blue: 17 only; pink: 19 only; yellow: 17 and 19); and all decreasing (light gray).

