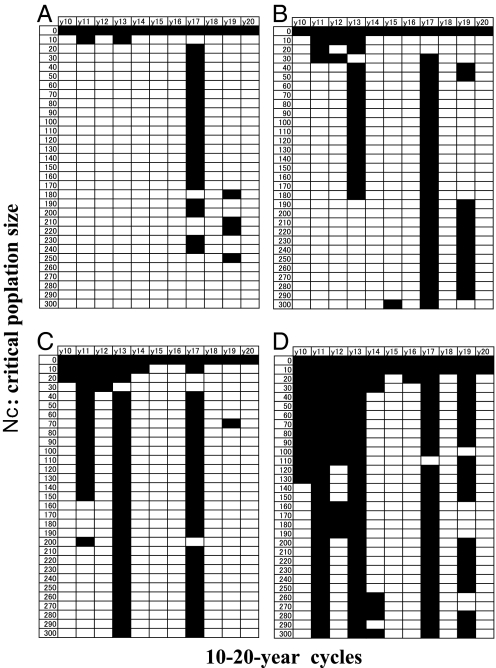
Fig. 5.
Surviving cycles among 11 pure broods at 10- to 20-year cycles with different levels of the Allee effect, where the extinction threshold is varied, such that Nc = 0 (no Allee effect), 10, 20, … , 300 (step = 10). The gray cells are surviving cycles. E = 0.24 (A), 0.26 (B), 0.27 (C), and 0.3 (D). Other parameters are S = 0.944, and C = 25. A–D correspond with the points along line S = 0.944 in the phase plane of Fig. 2A.

