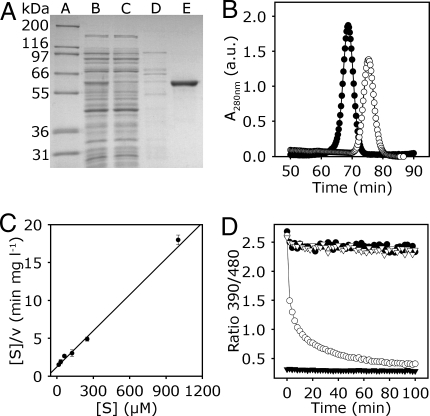
Fig. 1.
Biochemical characterization of cytosolic GR1. (A) Expression and purification of GR1. SDS/PAGE Gel stained with Coomassie Blue. Lane A, molecular mass standard. Lanes B–E, purification of GR1 expressed in E. coli HMS 174 cells, as follows: 8 μg of crude extract (lane B); 8 μg of flow through after loading the crude extract on Ni2+-NTA column (lane C); wash step with 80 mM imidazole (lane D); 2 μg of purified GR1 eluted with 150 mM imidazole (lane E). (B) Size exclusion chromatography of GR1 and BSA. Purified GR1 (peak A, ●) or BSA (peak B, ○) was chromatographed in 50 mM Tris, pH 8, 250 mM NaCl. Peak A corresponds to ≈120 kDa and peak B to ≈70 kDa. a.u., arbitrary units. (C) Kinetic mechanism of GR1. Hanes plot for kinetic analysis of GR1 regarding the substrate GSSG is shown; experimental data are represented by symbols and the global fit of all data by a line (R2 = 0.92). The enzyme assay was performed with 200 μM NADPH and 15–1,000 μM GSSG. Mean values ± SD are shown (n = 3). (D) GR assay using GRX1-roGFP2 as a sensor for the actual EGSH generated from the mixture of substrate (GSSG) and product (GSH). Fully oxidized GRX1-roGFP2 was mixed with NADPH (100 μM) and with (○) or without (▿) 0.1 μM AtGR1 at pH 7.0. 2 min after start of the measurement freshly prepared GSH solution was added to a final concentration of 2 mM. For control, full reduction of the probe was achieved with 10 mM DTT (▼), and full oxidation with 10 mM H2O2 (●).

