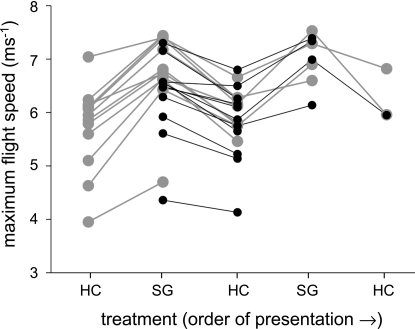
Fig. 2.
Effect of flow variability on maximum flight speed in Euglossa imperialis. Lines connect maximum speeds for individual bees flying in front of the air jet as honeycomb (HC; high flow variability) and square grids (SG; lower flow variability) were alternated. Some bees flew with the honeycomb in place initially (n = 13, gray) and others with the square grid (n = 11, black). Symbols represent the higher of 2 maximum speeds recorded for each treatment. Maximum speed was significantly higher when the square grid was in place (paired t test on maxima over all alternations, P < 0.0001).

