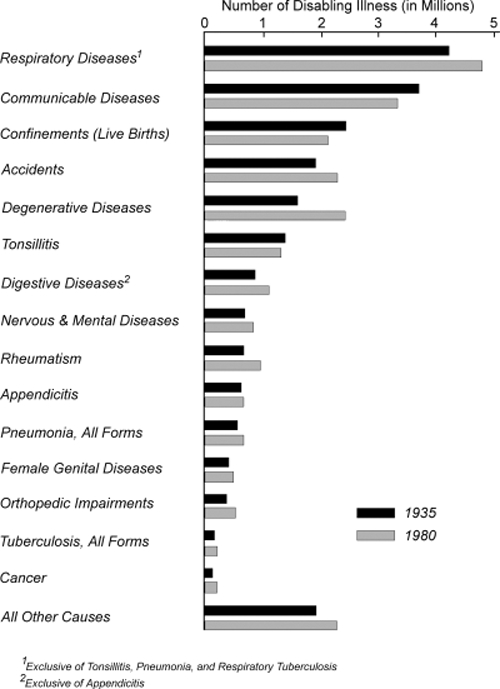
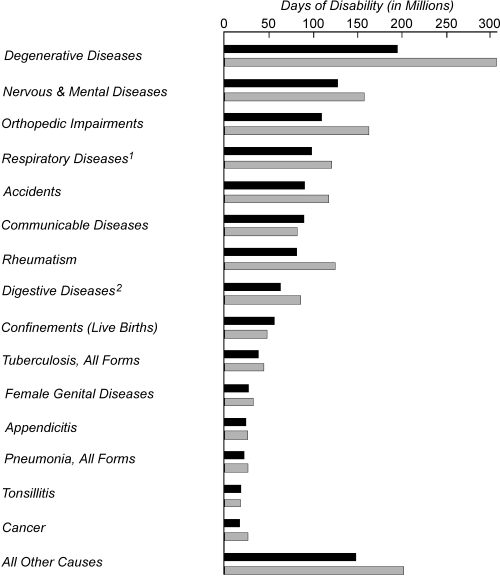
Figure 2.


Number of Disabling Illnesses and Days of Disability in a Twelve-Month Period in the United States in 1935 and 1980 according to Cause, Estimated on the Basis of the Frequency and Disability Rates Observed in Cities of 100,000 and over Canvassed in the National Health Survey, 1935–1936, Adjusted for Age. (The method of estimating the data relating to confinements terminating in live births is described on page 581 of the text.)
