
Figure 9.
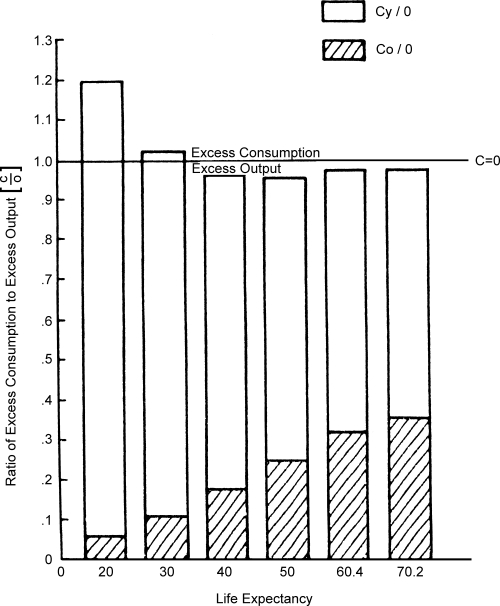
Relative Excesses in Consumption and Output for Stable Male Population at Various Life Expectancy Levels
Sources: Calculated, as described in the text, using Department of Social Affairs, Population Branch, Age and Sex Patterns of Mortality: Model Life Tables for Underdeveloped Countries, Population Studies, No. 22, New York, United Nations, 1955: and Sauvy, A., General Theory of Population, New York, Basic Books, Inc., Publishers, 1969.