
Figure 6.
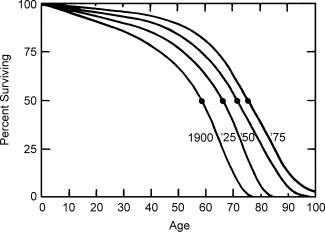
The Curves That Are Not. These survival curves would suggest an increasing life span, but only the median values and the 1950 curve are the true ones. The actual data are shown in Figure 4. Reprinted with permission from J.F. Fries and L.M. Crapo, Vitality and Aging (San Francisco: W.H. Freeman, 1981).