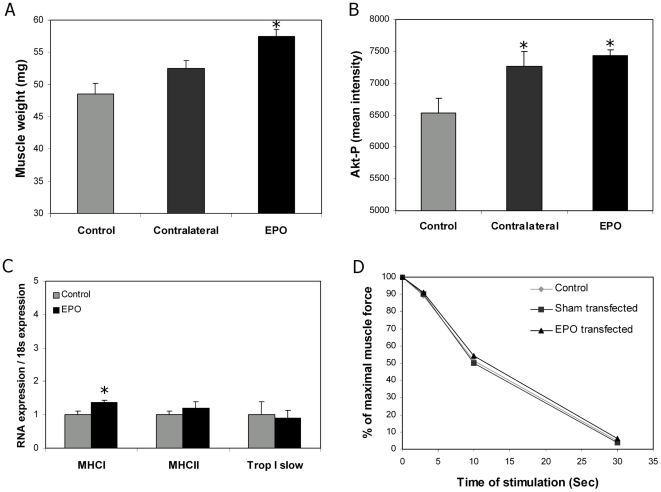
Figure 2. EPO expression is associated with muscle hypertrophy.
The muscle hypertrophic response was evaluated 5 weeks after DNA electrotransfer in mice placed on the regular chow diet. Each group consisted of 8 mice. For A and B, data from muscles from control mice (control), the contra lateral leg of the EPO transfected mice (contralateral), and the EPO transfected leg (EPO) are shown. Means±SEM are depicted. A) Total muscle weight, B) phosporylated Akt determined by Western Blotting, C) expression of muscle fibre protein (Q-PCR) in control and EPO transfected muscles, and D) muscle stamina in % of the control leg. Statistical significance was tested by Student's t-test with Bonferroni corrections for multiple testing. * indicates significance at p<0.05.

