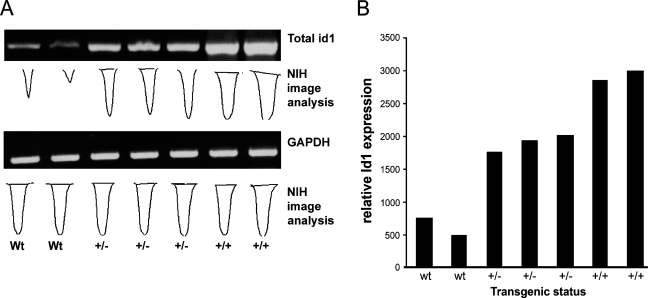
Figure 3.
Identification of Id1 mRNA expression in transgenic animals. (A) Heterozygous animals exhibited higher levels of total Id1 mRNA than did their wild-type counterparts, and the homozygous animals exhibited a further increase. National Institutes of Health image analysis was used to quantitate the intensity of the Id1 and housekeeping bands. (B) The ratio of Id1 band intensity to the intensity of the housekeeping band is depicted in the bar graph.

