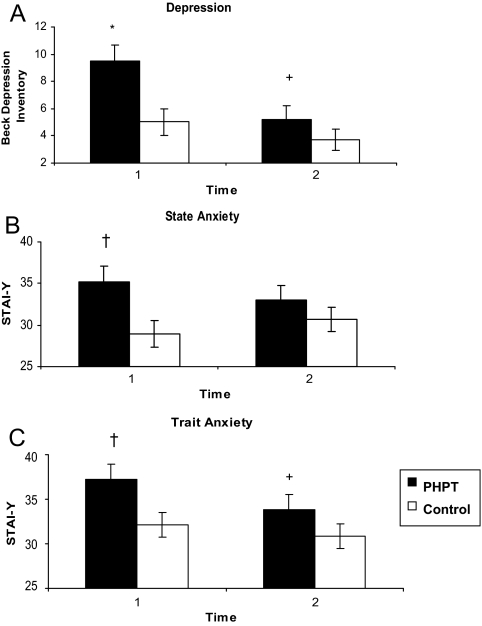
Figure 1.
A, Depression measured by BDI. B and C, State and trait anxiety as measured by STAI-Y. Higher scores indicate more symptoms. Scores are adjusted for age, IQ, and education. *, P < 0.01 compared with control group; †, P < 0.05 compared with control group; +, P < 0.01 compared with baseline. The test used to determine significance is the linear mixed model for repeated measures. Error bars represent 1 sem.

