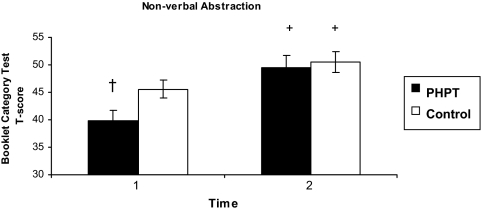
Figure 4.
Nonverbal abstraction assessed by BCT. Higher scores indicate better performance. Scores are adjusted for age, IQ, education, anxiety, and depression. †, P < 0.05 compared with control group; +, P < 0.01 compared with baseline. The test used to determine significance is the linear mixed model for repeated measures. Error bars represent 1 sem.

