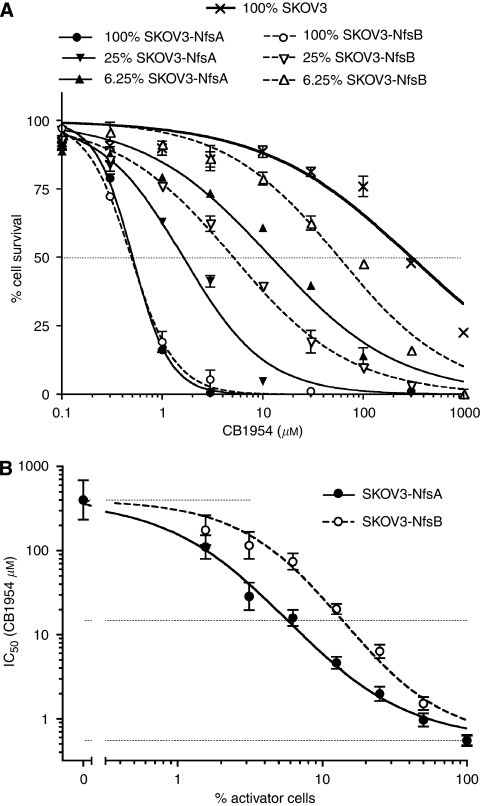
Figure 5.
Bystander effect with NfsA vs NfsB. (A) ‘Activator cells’, that is, SKOV3 cells stably expressing either NfsA or NfsB, parental SKOV3 cells and cell mixtures containing 50, 25, 12.5, 6.25, 3.12 and 1.56% of the activator cells mixed with SKOV3 target cells, were exposed to a range of CB1954 concentrations, and their subsequent survival determined using the MTT assay; symbols show the mean and range of duplicate wells. For clarity, only dose-response curves for 25 and 6.25% activator cells are shown. (B) The IC50s (±95% CI), derived from the MTT assay cell survival curves in panel A are plotted against percentage (%) activator cells in the mixture. The horizontal lines indicate the IC50s of parental SKOV3 cells (upper line), pure cultures of SKOV3-NfsA and SKOV3-NfsB (lower line), and the prodrug concentration midway between these on a log scale.

