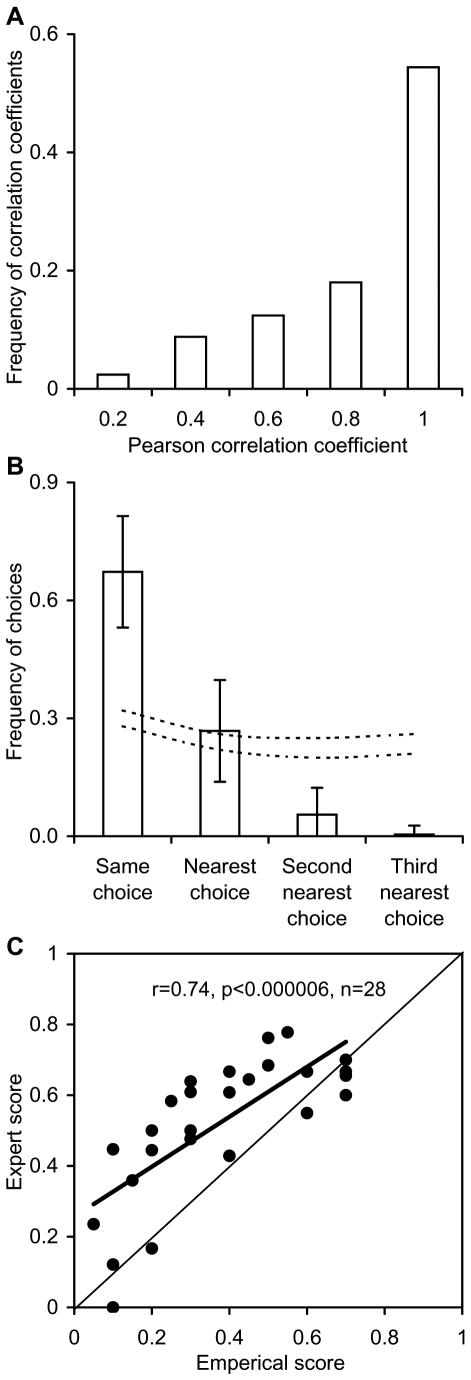
Figure 1. Reliability and validity of the expert's answers.
Validity refers to the degree to which the responders' answers approach the truth. Reliability refers to the extent to which different experts agreed in their answers. (A) Using countries for which duplicated responses were obtained, we show the frequency distribution of the Pearson correlation coefficients contrasting each responder to other responders in the same country. (B) depicts the frequency with which responders chose the same score or the next closest choice. Dotted lines in the plot indicate the confidence limits of a null model in which the levels of agreement were measured when choices were made randomly. The confidence limits are based on 1,000 repetitions of this null model. The error bars indicate standard deviation. (C) Using empirical data collected by another study [15], we show the similarities between our expert-based score and an empirically based score for a particular question (see Materials and Methods). The diagonal line indicates the 1:1 ratio.

