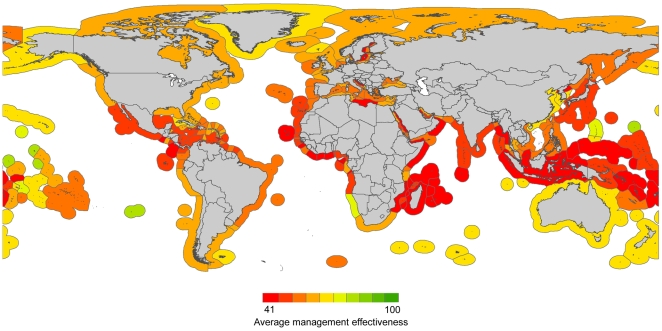
Figure 4. Overall management effectiveness of the world's exclusive economic zones.
This map shows the average, for each surveyed area, of their scores on the scales of scientific robustness, policymaking transparency, implementation capability, fishing capacity, subsidies, and access to foreign fishing.

