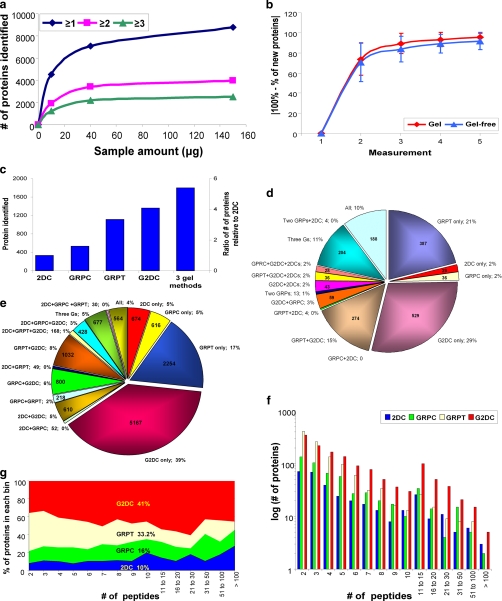
Fig. 2.
Analysis of protein and unique peptide identifications by all four methods. a, optimal sample quantity for gel-based method. The number of proteins identified (from supposed non-redundant rat database without further removing redundancy) by GRPC based on one, two, or three unique peptides is shown for 10-, 40-, and 150-μg samples. b, number of replicates required for 95% analytical completeness. The number of newly identified proteins (mean ± S.D.) (y axis) of any given measurement is shown as the percentage of total proteins of the indicated number of measurement(s) (x axis). c, total number of proteins identified by each method individually and by all three gel-based methods. The y axis on the left denotes the number of proteins identified by each method, and the y axis on the right shows the ratio relative to 2DC. d, distribution of proteins identified among the four MS methods including all combinations (Three Gs means GRPC, GRPT, and G2DC). The number of proteins identified is provided inside the pie chart, and the percentage is next to the designation of method(s). e, distribution of the unique peptides detected by each method and all combinations. f, histogram of number of proteins identified by each method according to the number of unique peptides for that protein. The number of proteins (graphed on a log10 scale) is plotted by each binned peptide group. g, peptide space map. After binning each protein according to the number of peptides detected in each method, the percentage of peptides identified in each bin for the four methods was calculated and plotted.

