Fig. 3.
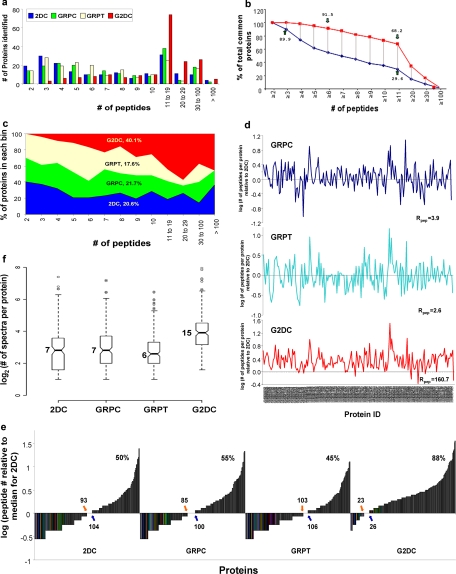
Analysis of protein coverage by all four methods. The 187 proteins common to all four MS methods were grouped according to the number of unique peptides detected for that protein. a, histogram of the number of proteins identified by each method (as indicated). b, number of proteins identified by G2DC versus 2DC according to the number of peptide detected, shown as percentage of total common proteins. c, peptide space map of common proteins. d, ratio of number of unique peptides detected in each protein by each gel-based method relative to the number of unique peptides detected by 2DC (log10 scale). The calculated ratio, Rpep, for each gel-based method is indicated (see Equation 4 under “Experimental Procedures”). e, distribution of peptides detected for each common protein. The number of unique peptides detected by each method for each common protein, normalized by median number for 2DC (log10 scale), is plotted against common proteins. The number of proteins with <7 unique peptides (the median for 2DC) is shown next to the orange arrow, the number of proteins with >7 unique peptides is next to the blue arrow, and the number of proteins with ≥7 unique peptides is shown as a percentage (top panel of each method). f, box plots of the distribution of the number of unique peptides in common proteins detected by each method. All values, including smallest values, first quartiles (25% of the data), medians, third quartiles (75% of the data), greatest values, and outliers are graphed on a log2 scale. Raw values for the medians are indicated.

