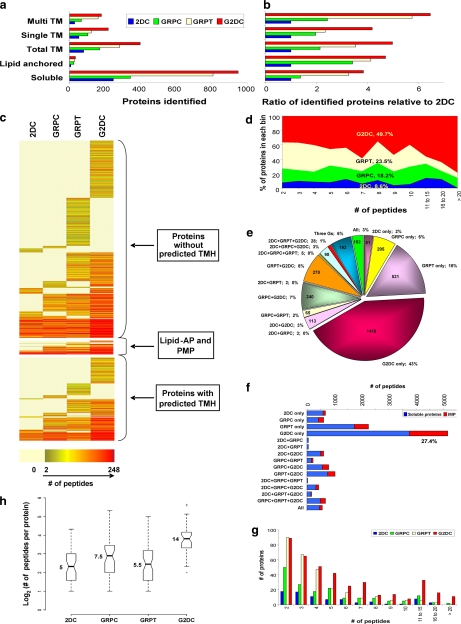
Fig. 4.
Analysis of integral membrane protein identifications. The total number of soluble proteins, lipid-anchored proteins, all IMPs, and IMPs with STM or MTM identified by each approach (a) and their ratio relative to 2DC (b) are shown. c, heat map representing all proteins identified by all four methods. Proteins are clustered by type of membrane association and color-coded by number of unique peptides detected for each method. Each row represents a specific protein. d, peptide space map of IMPs. e, distribution of unique peptides of IMPs among the four MS methods individually and by all combinations. f, the bar chart represents the number of unique peptides from soluble proteins and IMPs detected by each method individually and by all combinations. g, histogram of the number of IMPs identified by each method in each binned group of number of predicted transmembrane domains. h, box plots depict the distributions, by method, of unique peptides per IMP identified in common to all four method shown in a log2 scale. Raw values for medians are shown. AP, anchored protein; TMH, transmembrane helices; PMP, peripheral membrane protein; TM, transmembrane domains.

