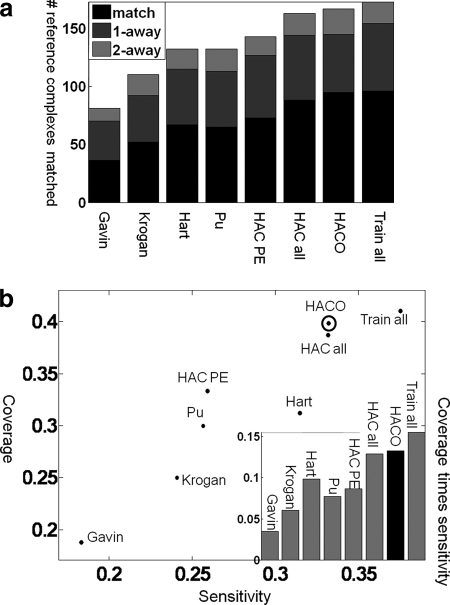
Fig. 1.
Accuracy in reconstructing reference complexes. A comparison of predicted complexes to other state-of-the-art methods in the ability to accurately reconstruct reference complexes is shown. a, the number of reference complexes well matched by our predictions (y axis) and for the different methods we compared (x axis). The prediction quality is shown as bars: black, perfect prediction; dark gray, predictions that differ by a single protein (one extra or one fewer); light gray, predictions that differ by two proteins. Hart et al. (5) and Pu et al. (6) are state-of-the-art methods that outperform Gavin et al. (3) and Krogan et al. (4). The method of Bader and Hogue (62) has even lower accuracy (data not shown). Applying HAC to PE score (HAC PE) performed slightly better than Hart et al. (5) and Pu et al. (6), which use MCL. Our model, which uses LogitBoost and clustering, is able to achieve significantly better results than any other method by integrating multiple sources of data. The results are better even when we use simple HAC (HAC all; 88 perfect matches) for the clustering and improve further when we use HACO (95 perfect matches). This improvement is consistent over all five folds in our cross-validation process: over the five folds, HAC PE recovers 15, 11, 16, 22, and nine of the complexes; HAC all recovers 21, 13, 21, 23, and 10; and HACO recovers 24, 13, 23, 23, and 12. This consistency over folds demonstrates the robustness in the improvement we obtain using our method. In “Train all,” we trained on all data and tested on the same data; this method achieves only slightly higher accuracy, which indicates little overfitting to the training data and supports evaluating biological coherence of our predictions on this set. b, the x axis is the sensitivity of our predictions, which quantifies how likely a prediction is to match some reference complexes; the y axis is the coverage of our predictions, which quantifies how many reference complexes are matched by our predictions (see “Experimental Procedures”). Our approach has higher sensitivity and coverage than other methods. HACO has the highest product of sensitivity and coverage except for Train all, which trains and tests on the same data and thus provides an unachievable upper bound on performance.

