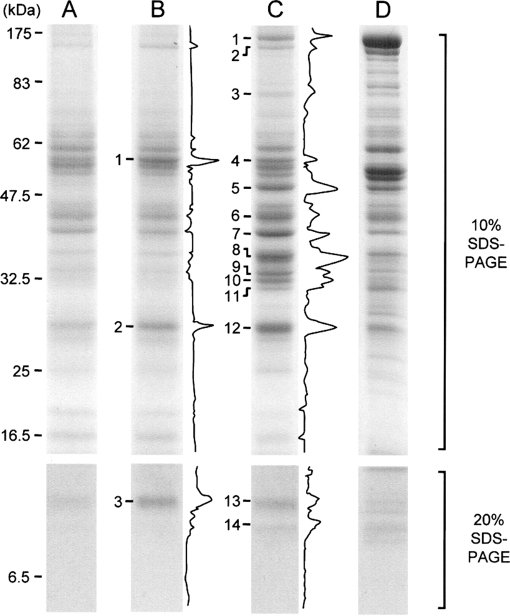
Fig. 4.
SDS-PAGE analysis of proteins present in the supernatants of treated and non-treated mitochondria. For lanes A–D, supernatants (15 μl/lane) of non-treated, valinomycin-treated, and Ca2+-treated mitochondria or whole proteins of rat liver mitochondria (5 μg/lane), respectively, were subjected to SDS-PAGE. Upper and lower photographs represent the results of SDS-PAGE using 10 or 20% acrylamide gel, respectively. Numbers shown at the left margin of lane A represent the size of proteins used as molecular mass markers and their migration position. Densitograms shown at the right margins of lanes B and C represent the differential densitograms obtained by the subtraction of the densitogram of lane A from that of lane B or lane C. The protein bands in lanes B and C numbered at their left margins were analyzed by LC-MS/MS. A typical result of three independent runs is shown.

