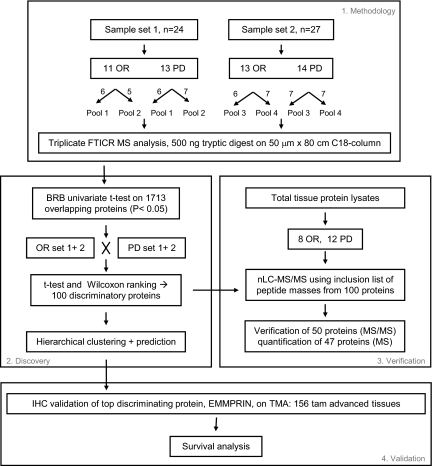
Fig. 2.
Data analysis flow chart. Tryptic digests from two independently processed sample sets were analyzed in triplicate by nano-LC-FTICR. MS peak intensity-derived peptide/protein abundances were subjected to statistical analysis to determine differentially abundant proteins between OR and PD samples in both sample sets combined as well as in the two samples sets separately. Subsequently hierarchical clustering and class prediction was performed. nLC, nano-LC.

