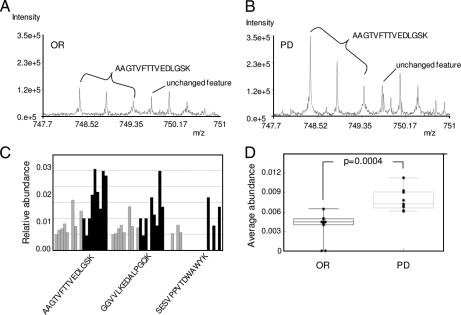
Fig. 3.
EMMPRIN differential peptide and protein abundance. Representative mass spectra of an LC-MS feature identified as EMMPRIN peptide AAGTVFTTVEDLGSK in OR (A) and PD (B) indicate a 3-fold increase in intensity for PD sample. C, relative abundance ratios of four EMMPRIN peptides in OR (gray) and PD (black) samples. D, average relative abundance of EMMPRIN protein in all OR and PD samples. p value was calculated using the Wilcoxon rank sum test. Box-Whisker plot in which each dot represents the value of a sample, and the error bars show the highest and lowest value. The line in the box represents the mean value.

