Fig. 6.
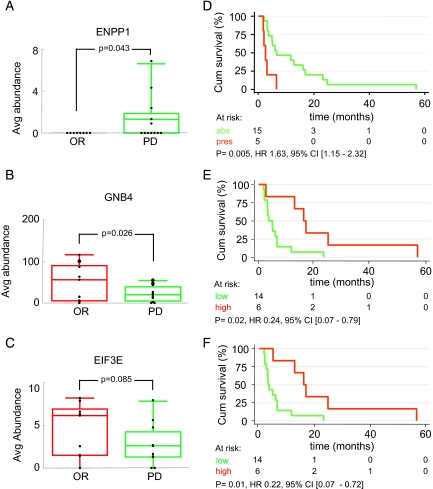
Clinical association of verified proteins. Differences in relative abundance ratios between OR (red) and PD (green) tumors for ENPP1 (A), GNB4 (B), and EIF3E (C) are shown. Shown is the Kaplan-Meier survival analysis of time to progression upon tamoxifen treatment for recurrent breast cancer patients according to LC-MS abundance levels. For ENPP1, absence (abs) (green line) and presence (pres) (red line) of abundance was compared (D). For GNB4 (E) and EIF3E (F) low abundance and medium abundance were grouped (green line) and compared with high abundance (red line). The number of patients at risk in each group is displayed together with the hazard ration, 95% confidence interval, and p value. Avg, average; Cum, cumulative; CI, confidence interval.

