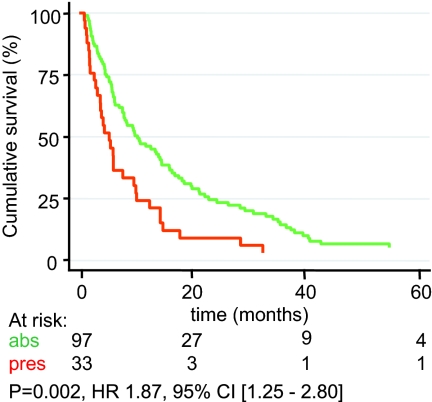
Fig. 8.
Kaplan-Meier survival analysis. EMMPRIN abundance was measured by IHC using TMA and was correlated to time to progression after the onset of first line tamoxifen treatment. Absence (abs) of detectable EMMPRIN (green line) was compared with presence (pres) (1+, 2+, and 3+) of EMMPRIN staining (red line).

