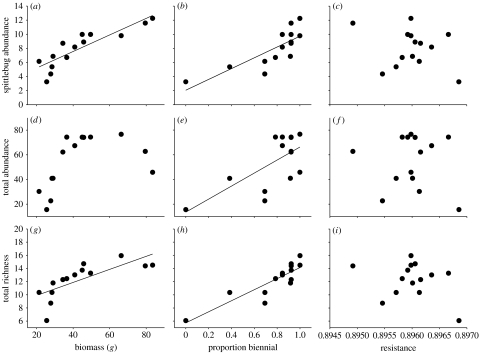
Figure 2.
Community–trait gradients of the relationship between community variables and plant traits. (a–i) The relationship between (a–c) P. spumarius abundance, (d–f) total arthropod abundance and (g–i) arthropod richness, and genetic variation in plant traits (biomass, proportion biennial and resistance) subject to directional selection. The best-fitting line is shown in figures where there was a significant linear community–trait gradient; variables exhibiting significant quadratic relationships are indicated in table 2.

