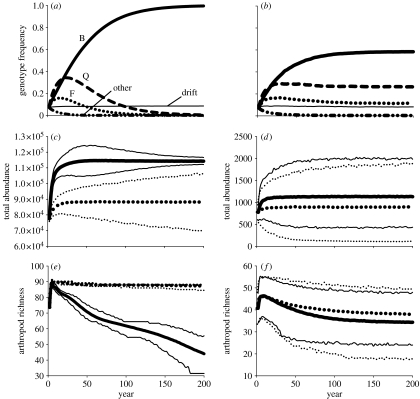
Figure 3.
Simulated evolution and community change in large (a,c,e; n=2800) and small (b,d,f; n=28) O. biennis populations. (a,b) We contrasted temporal changes in genotype frequencies in populations subject to selection (i.e. relative fitness of genotypes determined according to our experimental results; see methods in the electronic supplementary material) to populations where all genotypes had equal relative fitness and were therefore only influenced by genetic drift. We show the mean genotype frequencies (across 1000 simulations) of the three most fit genotypes in selected populations (B, F and Q), the mean frequency of all other genotypes in selected populations (‘other’ line) and the mean frequency of genotypes (‘drift’ line) in drift populations. (c,d) Mean total arthropod abundance and (e,f) mean arthropod richness summed across all plants in the population are shown from selected (bold solid curve) and drift (bold dotted curve) populations; thin solid and dotted curves show the upper and lower 95% CI around the mean selected and drift populations, respectively.

