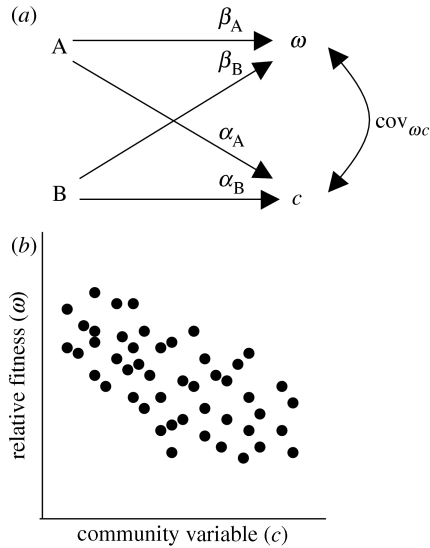
Figure 4.
(a,b) Path diagram illustrating the relationship between plant traits, relative fitness and community variation. Two plant traits A and B causally influence variation in relative fitness (ω) according to path coefficients βA and βB. These same traits influence variation in a community variable (c) according to coefficients αA and αB. The resulting covariance between ω and c is denoted by covωc.

