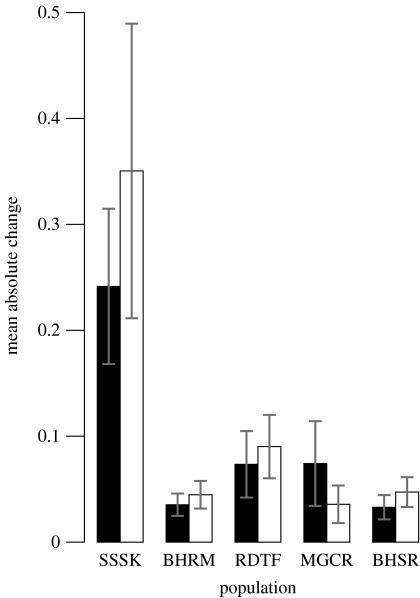
Figure 2.
Mean absolute change of environment (black bars) and phenotype (white bars) with 95% parametric confidence intervals for each population, calculated following eqn (8) by Hairston et al. (2005). The change quantifies the effects on population growth of environmental and phenotypic changes, respectively. Absolute rates are presented since changes in environmental and phenotypic variables can be negative as well as positive. Study population codes: SSSK, Soay sheep; BHRM, bighorn sheep at Ram Mountain; RDTF, roe deer; MGCR, mountain goats; BHSR, bighorn sheep at Sheep River.

