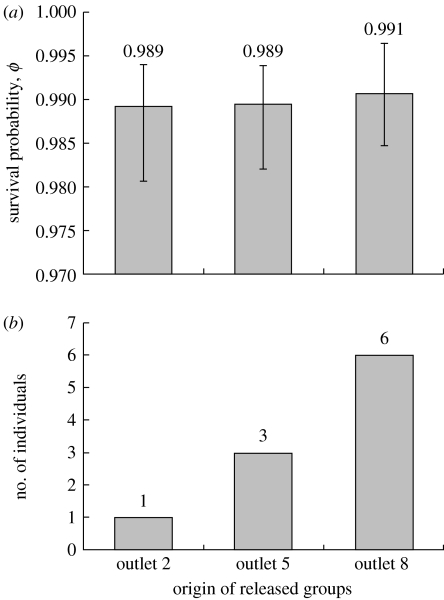
Figure 3.
Results of the transplant experiment testing for local adaptation in fish transplanted from three different outlet sites (sites 2, 5 and 8) to outlet site 8. (a) Survival probabilities for the three groups one month after their release into site 8. Error bars are 95% confidence intervals calculated by program Mark. (b) The number of individuals from each release group captured 1 year after their release into site 8 (the number of released individuals was 38 for each of the three groups).

