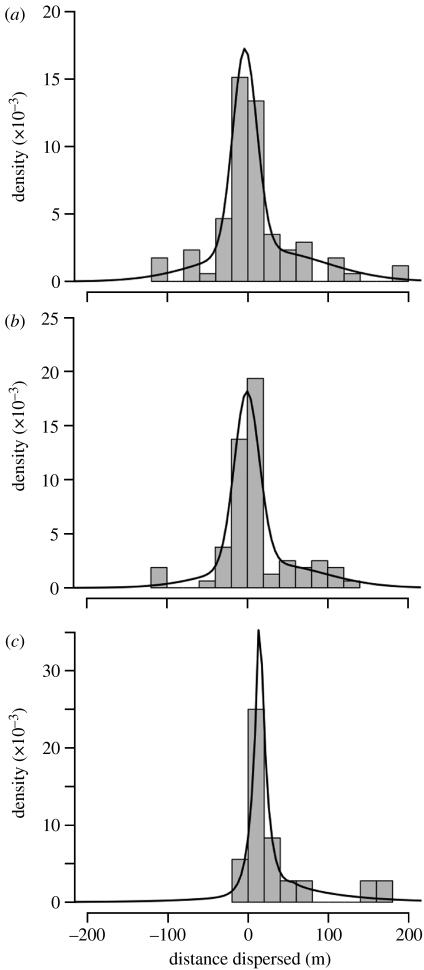
Figure 5.
(a–c) DDDs of marked individuals recorded two (outlet sites 2 and 5) and four (outlet site 5) weeks after release ((a) outlet 5, week 2; (b) outlet 5, week 4; (c) outlet 2, week 2). Positive distances represent upstream dispersal and negative distances represent downstream dispersal. The thick lines are the theoretical distributions that best fit the empirical distributions: a mixture of two normal distributions for both DDDs from outlet site 5 and a mixture of two Laplace distributions for outlet site 2 (see table 3.1 in appendix 3 of the electronic supplementary material).

