
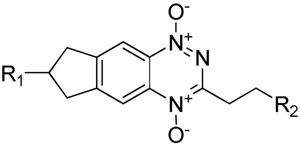
Table 3.
Physicochemical, in vitro and modelling parameters for TPZ and TTOs 33–42.
 | |||||||||||||||
|---|---|---|---|---|---|---|---|---|---|---|---|---|---|---|---|
| No | R1 | R2 | pKaa | logP7 calcb.4 | Sol.c mM | E(1) mV | HT29IC50 hypox μM | HT29 HCRd | SiHa IC50 hypox μM | SiHa HCRd | D calce,f | kmetf,g min−1 | X½f,h μm | AUCreqi μM.min | HCDj |
| 1k | nal | nal | nal | −0.33 | 9 | −456 | 5.1 | 71 | 2.5 | 107 | 4.2 | 0.58 | 45 | 10200 | 4.1 |
| 33 | CH3 | CH2OH | 0.0 | 1.14 | 10 | 13.0 | 80 | 8.0 | 104 | 21.0 | 0.24 | 158 | 10300 | 10.9 | |
| 34 | CH3 | CH2N-morpholine | 7.1 | 0.99 | 36 | 2.9 | 72 | 1.7 | 134 | 21.0 | 0.96 | 80 | 4960 | 5.8 | |
| 35 | CH2OH | H | 0.0 | 0.69 | 5 | −452 | 17 | 45 | 6.5 | 48 | 17.7 | 0.47 | 104 | 4150 | 9.2 |
| 36 | CH2N-morpholine | H | 7.0 | 0.29 | 43 | 4.8 | 31 | 2.4 | 62 | 17.3 | 0.54 | 96 | 3390 | 8.8 | |
| 37 | CH2OH | CH2N-morpholine | 7.1 | −0.18 | 48 | −408 | 2.4 | 121 | 1.8 | 206 | 3.8 | 0.90 | 35 | 14100 | 2.7 |
| 38 | (CH2)2OH | H | na | 0.50 | 2 | 7.7 | 102 | 2.9 | 86 | 15.4 | 0.54 | 91 | 6130 | 8.6 | |
| 39 | (CH2)3N-morpholine | H | 7.5 | 0.50 | >51 | −431 | 3.6 | 36 | 1.3 | 84 | 18.5 | 0.54 | 100 | 2560 | 8.7 |
| 40 |
|
CH2N-morpholine | 7.1 | −1.30 | 51 | −468 | 8.9 | 25 | 5.1 | 43 | 3.5 | 0.31 | 57 | 6680 | 5.7 |
| 41 |
|
H | 5.8 | 0.09 | >47 | −344 | 13.1 | 2 | 3.1 | 6 | 20.9 | ||||
| 42 |
|
H | 5.2 | 0.19 | |||||||||||
Calculated using ACD pKa.
Calculated using ACD logD.
Solubility of HCl salts in culture medium.
Hypoxia Cytotoxicity Ratio = oxic IC50/hypoxic IC50.
Diffusion coefficient in HT29 MCLs ×10−7 cm2s−1.
Error estimates are provided in the Supporting Information.
First order rate constant for metabolism in anoxic HT29 cell suspensions, scaled to the cell density in MCLs.
Penetration half distance in anoxic HT29 tumor tissue (see text).
Predicted area under the plasma concentration-time curve required to give 1 log of cell kill in addition to that produced by a single 20 Gy dose of gamma radiation.
In vivo Hypoxic Cytotoxicity Differential = LCKhypoxic/LCKoxic.
Data from Reference 48.
Not applicable.