Figure 2.
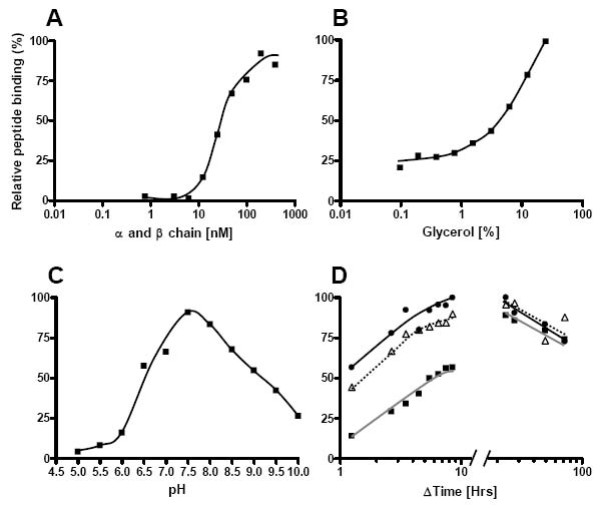
Initial optimization of DR1 refolding. DR1 refolding was determined using a radioactive peptide and spun column separation of free and HLA-DR1 bound peptide. Y-axis shows the relative amount of radioactive peptide bound in each experiment. (A) Titration of equimolar concentrations of urea denatured DR1 α and β chain into a refolding buffer containing 3 nM 125I labelled (Y)HA306–318 peptide. In experiments B-D, the DR1 concentration used was at 80 nM. (B) Titration of Glycerol from 25 to 0.1%(v/v). (C) Impact of pH on DR1 complex formation. (D) Kinetic of DR1 complex formation at three different temperatures (black square, grey line) 10°C, (triangle, dotted line) 20°C and (black circle, black line) 30°C.

