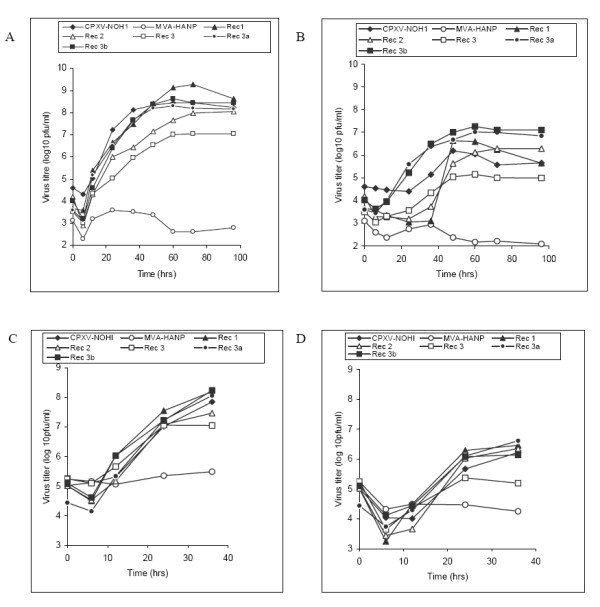
Figure 3.

Time course of virus production in Vero cells at low and high multiplicity of infection. Confluent Vero cells were infected with the respective virus strains at low m.o.i (0.01 pfu per cell) and high m.o.i (5.0 pfu per cell). Virus production in the cell (A) and virus released to the supernatant (B) at low m.o.i. Virus production in the cell (C) and virus released to the culture medium (D) at high m.o.i. Values are means of two independent experiments titrated in duplicates.
