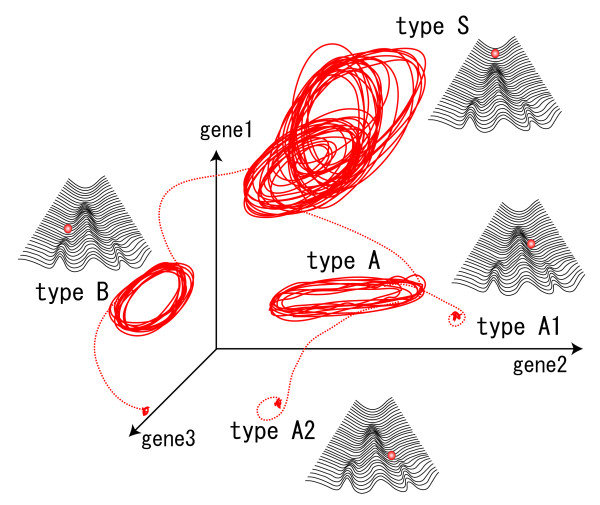
Figure 1.
A Schematic representation of phase-space which represents expression dynamics of several cell types. Each axis shows the expression level of a gene. The trajectory in the phase space represents the time course of expression profile, where attractors correspond to distinct cell types, i.e., type S, A1, A2, and B. In this example, type-S cells act as stem-type cells, which can differentiate into type-A, B, while differentiated types lose the potential to differentiate into other cell types. The epigenetic landscape of cellular states is also shown, in which the change of cellular state is represented as the trajectory of a ball falling along branching valleys.

