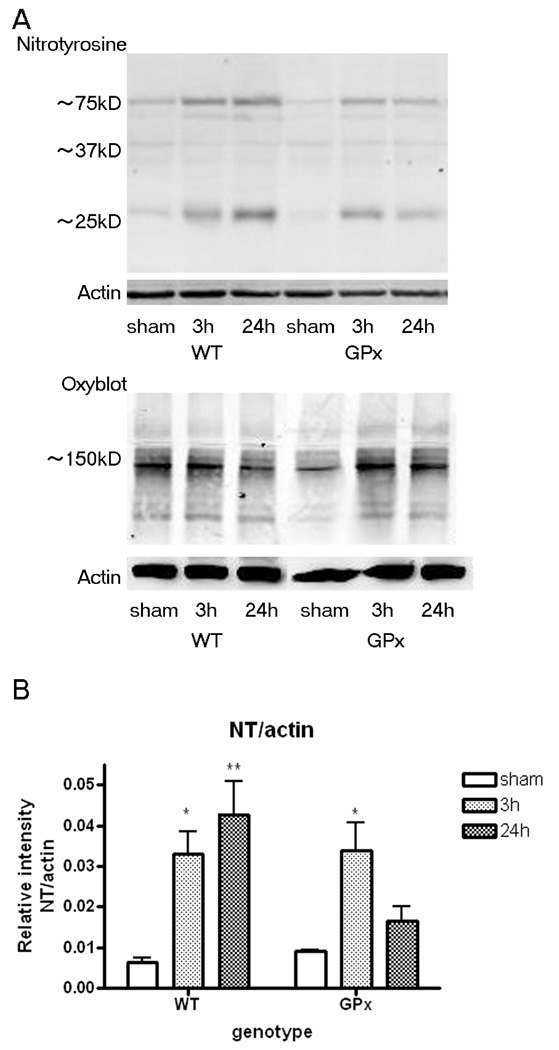
Figure 2. Oxidative stress in the hippocampus after TBI.

A) Representative immunoblots of oxidative stress markers, protein carbonyls (Oxyblot) and nitrotyrosine, within 24 hours postinjury. A 150kD protein carbonyl band showed a trend toward differences in genotypes (two-way ANOVA; interaction p=0.99; genotype p=0.062). Nitrated protein bands in injured brains of both genotypesare observed at 75, 37 and 25kD.
B) The 25kD nitrated protein band remains elevated 24 hours postinjury in the WT group. A similar temporal change is not seen in the GPxTg group. (ANOVA genotype × time point interaction p=0.0572; Bonferroni post-tests, * p<0.05, ** p<0.01 relative to sham)
Note that the intensity of each sample was quantified and corrected as a relative intensity to loading control, actin.
